You may collect many data about your delivery operations. But they would only be helpful if you knew how to get the most out of it. And that’s where last-mile analytics swoops in.
Last-mile analytics tools make your data come alive. It helps you answer important questions like “Why are fuel expenses going up?” or “What are the key factors driving customer satisfaction?”
By examining the granular details and diving deep into the data, you gain a comprehensive understanding of what’s really happening and why. No more guesswork – last-mile analytics brings you concrete evidence and hard facts.
Long story short, it helps you make sense of the overwhelming sea of information and guide your business in the right direction. And you don’t need to be a data expert to reap the benefits.
So, in this quick guide, we’ll walk you through the concept of last-mile analytics in detail, benefits, and, most importantly, how Route4Me’s delivery planning software can help.
Table of Contents
What is Last-Mile Analytics?
Last-mile analytics refers to gathering, comprehending, and utilizing data related to the final delivery stage.
It enables organizations across logistics, transportation, retail, and eCommerce industries to gain valuable insights into their last-mile operations. Such insights help optimize delivery, improve customer experience, and reduce expenses.
Want To See For Yourself How Route4Me Can Help Track and Analyze Last-Mile Deliveries Efficiently?
Benefits of Last-Mile Analytics
Last-mile analytics tools transform raw data into actionable insights that can fuel your business growth. Here is how it can benefit your business.
Optimize Delivery Routes
Last-mile analytics tools help you analyze data on traffic patterns, real-time conditions, and historical delivery performance. So you can plan the most efficient routes, reducing delivery times and costs.
Create a Positive Impact on the Environment
Optimized delivery routes also mean less fuel consumption, carbon emissions, and environmental impact. This aligns with your green initiatives and improves your brand reputation.
Allocate Resources Efficiently
You can allocate resources efficiently by analyzing data on delivery volumes, customer locations, and transportation capacities. This leads to improved fleet utilization, reduced costs, and better resource management.
Address Issues Proactively
By analyzing data on delivery performance, customer feedback, and external factors, you can detect patterns, anticipate challenges, and take preventive actions. This helps you avoid disruptions, minimize customer complaints, and maintain a high level of service quality.
How Route4Me Route Planner Can Help with Last-Mile Analytics
Route4Me’s last-mile optimization solution offers a reporting and analytics feature to help you track and analyze your last-mile initiatives and ensure efficiency. Here’s a breakdown of what all you can evaluate.
Planned vs. Actual Dashboard
Route4Me’s Dashboard helps you collect and analyze a wide range of actionable last-mile insights and real-time data from your teams, fleets, routes, orders, vendors, customers, and other valuable assets. It offers a centralized control panel that seamlessly synchronizes all this information.
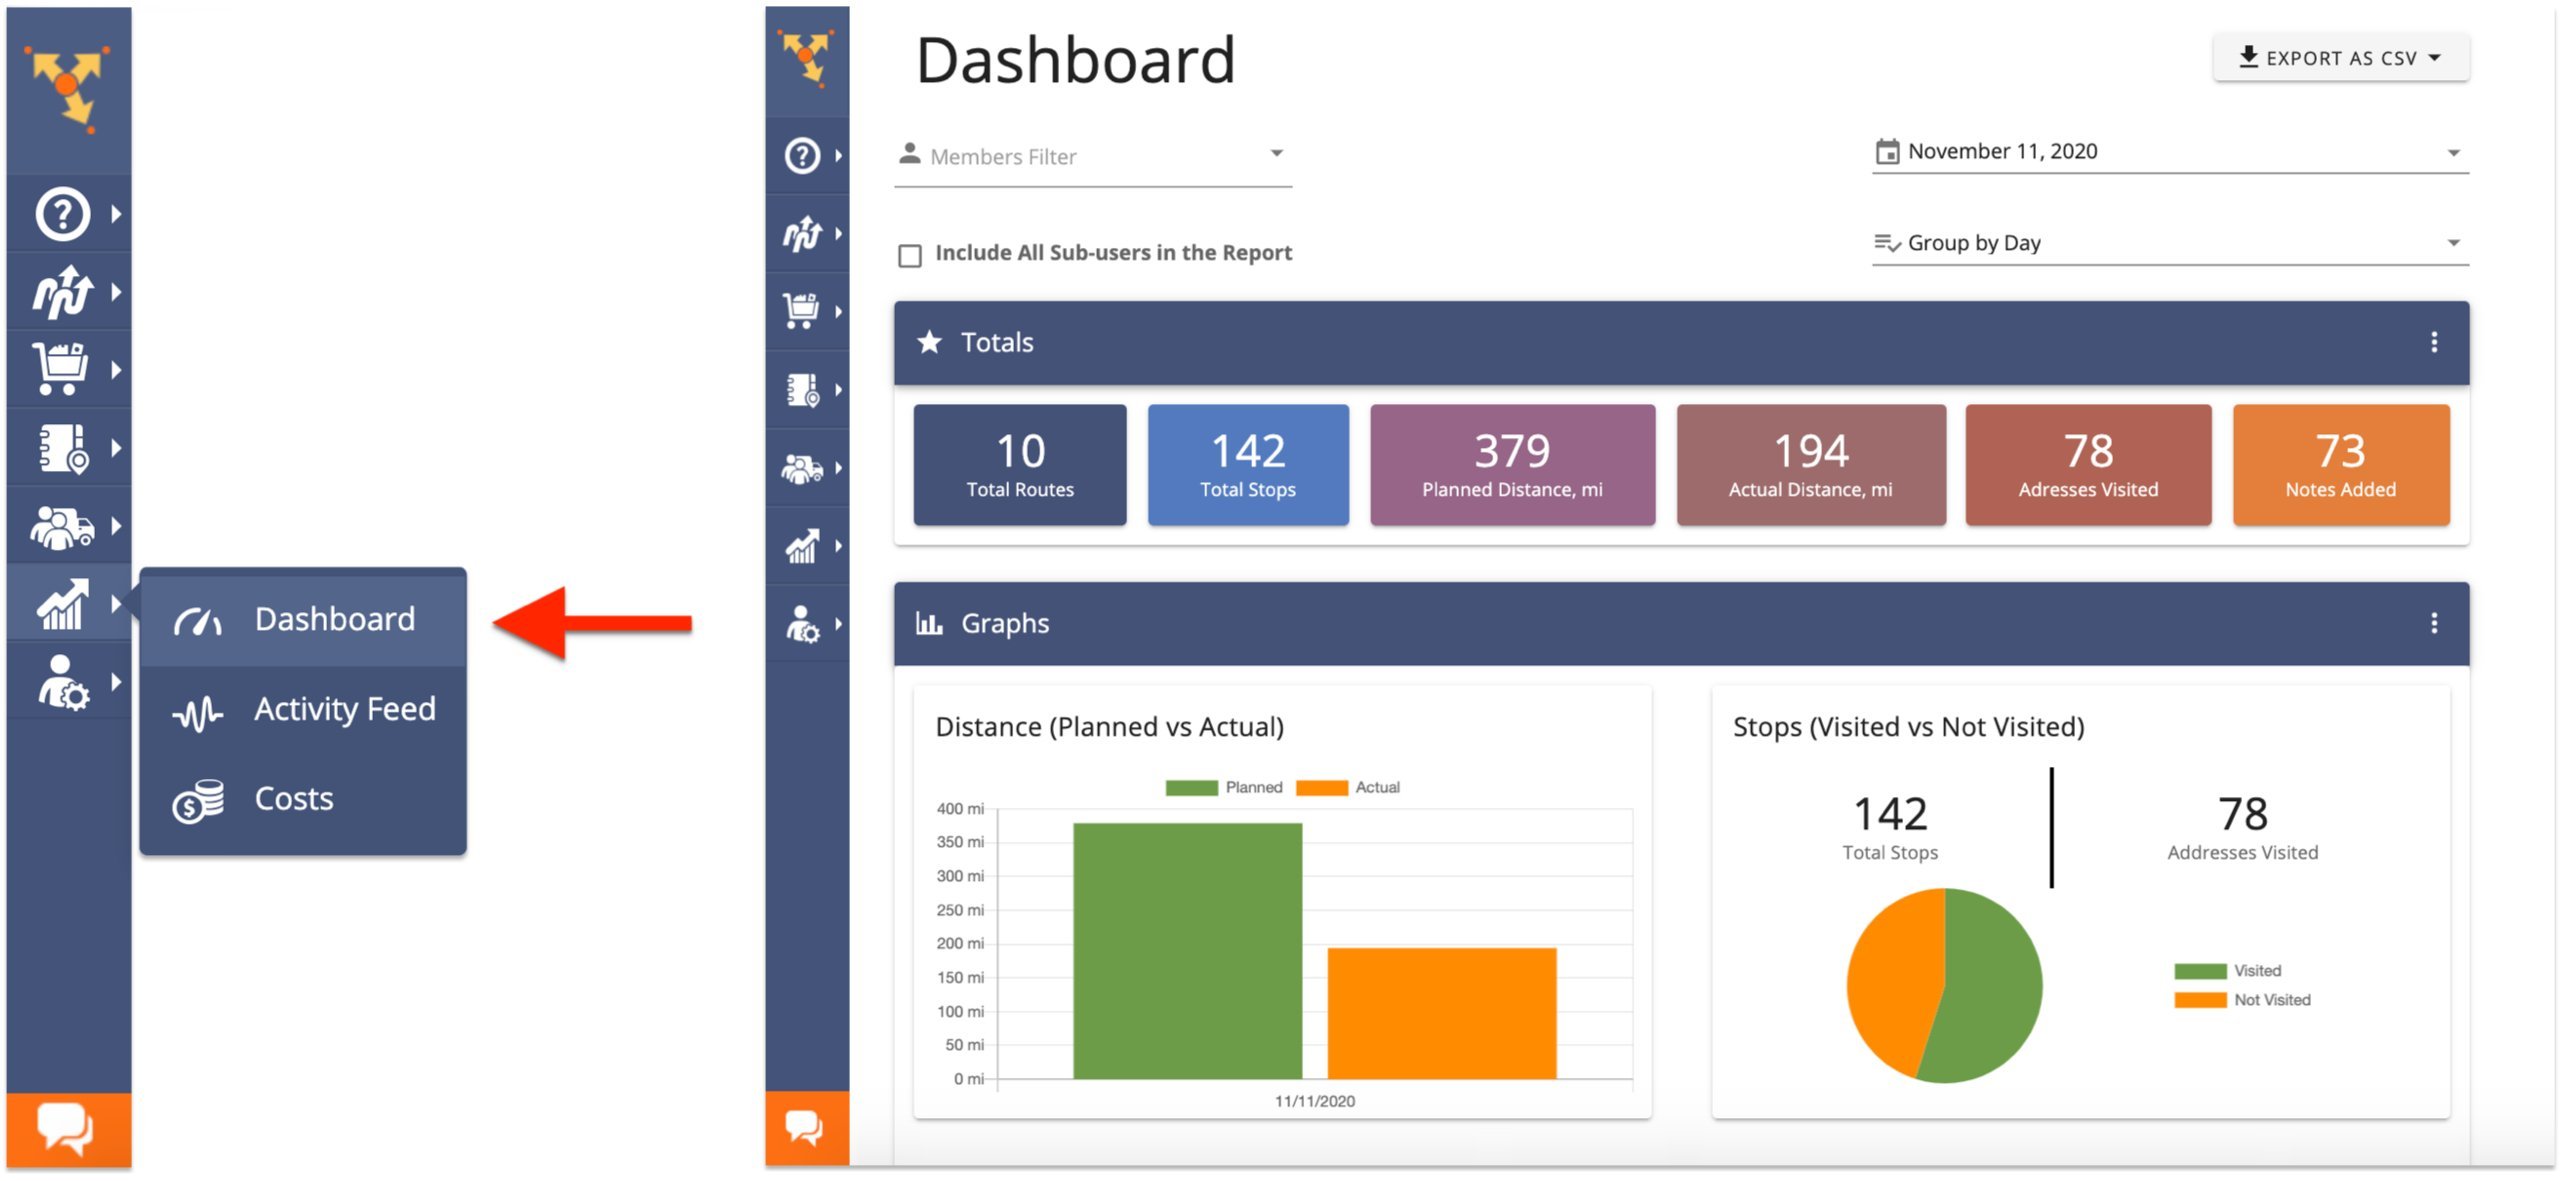
Route4Me’s Analytics and Reporting Dashboard consists of three primary sections:
Filters
The filters enable you to sort, group, and filter all the data presented on the Dashboard, allowing you to view the information that matters most. You can filter data by date, team member, and more.
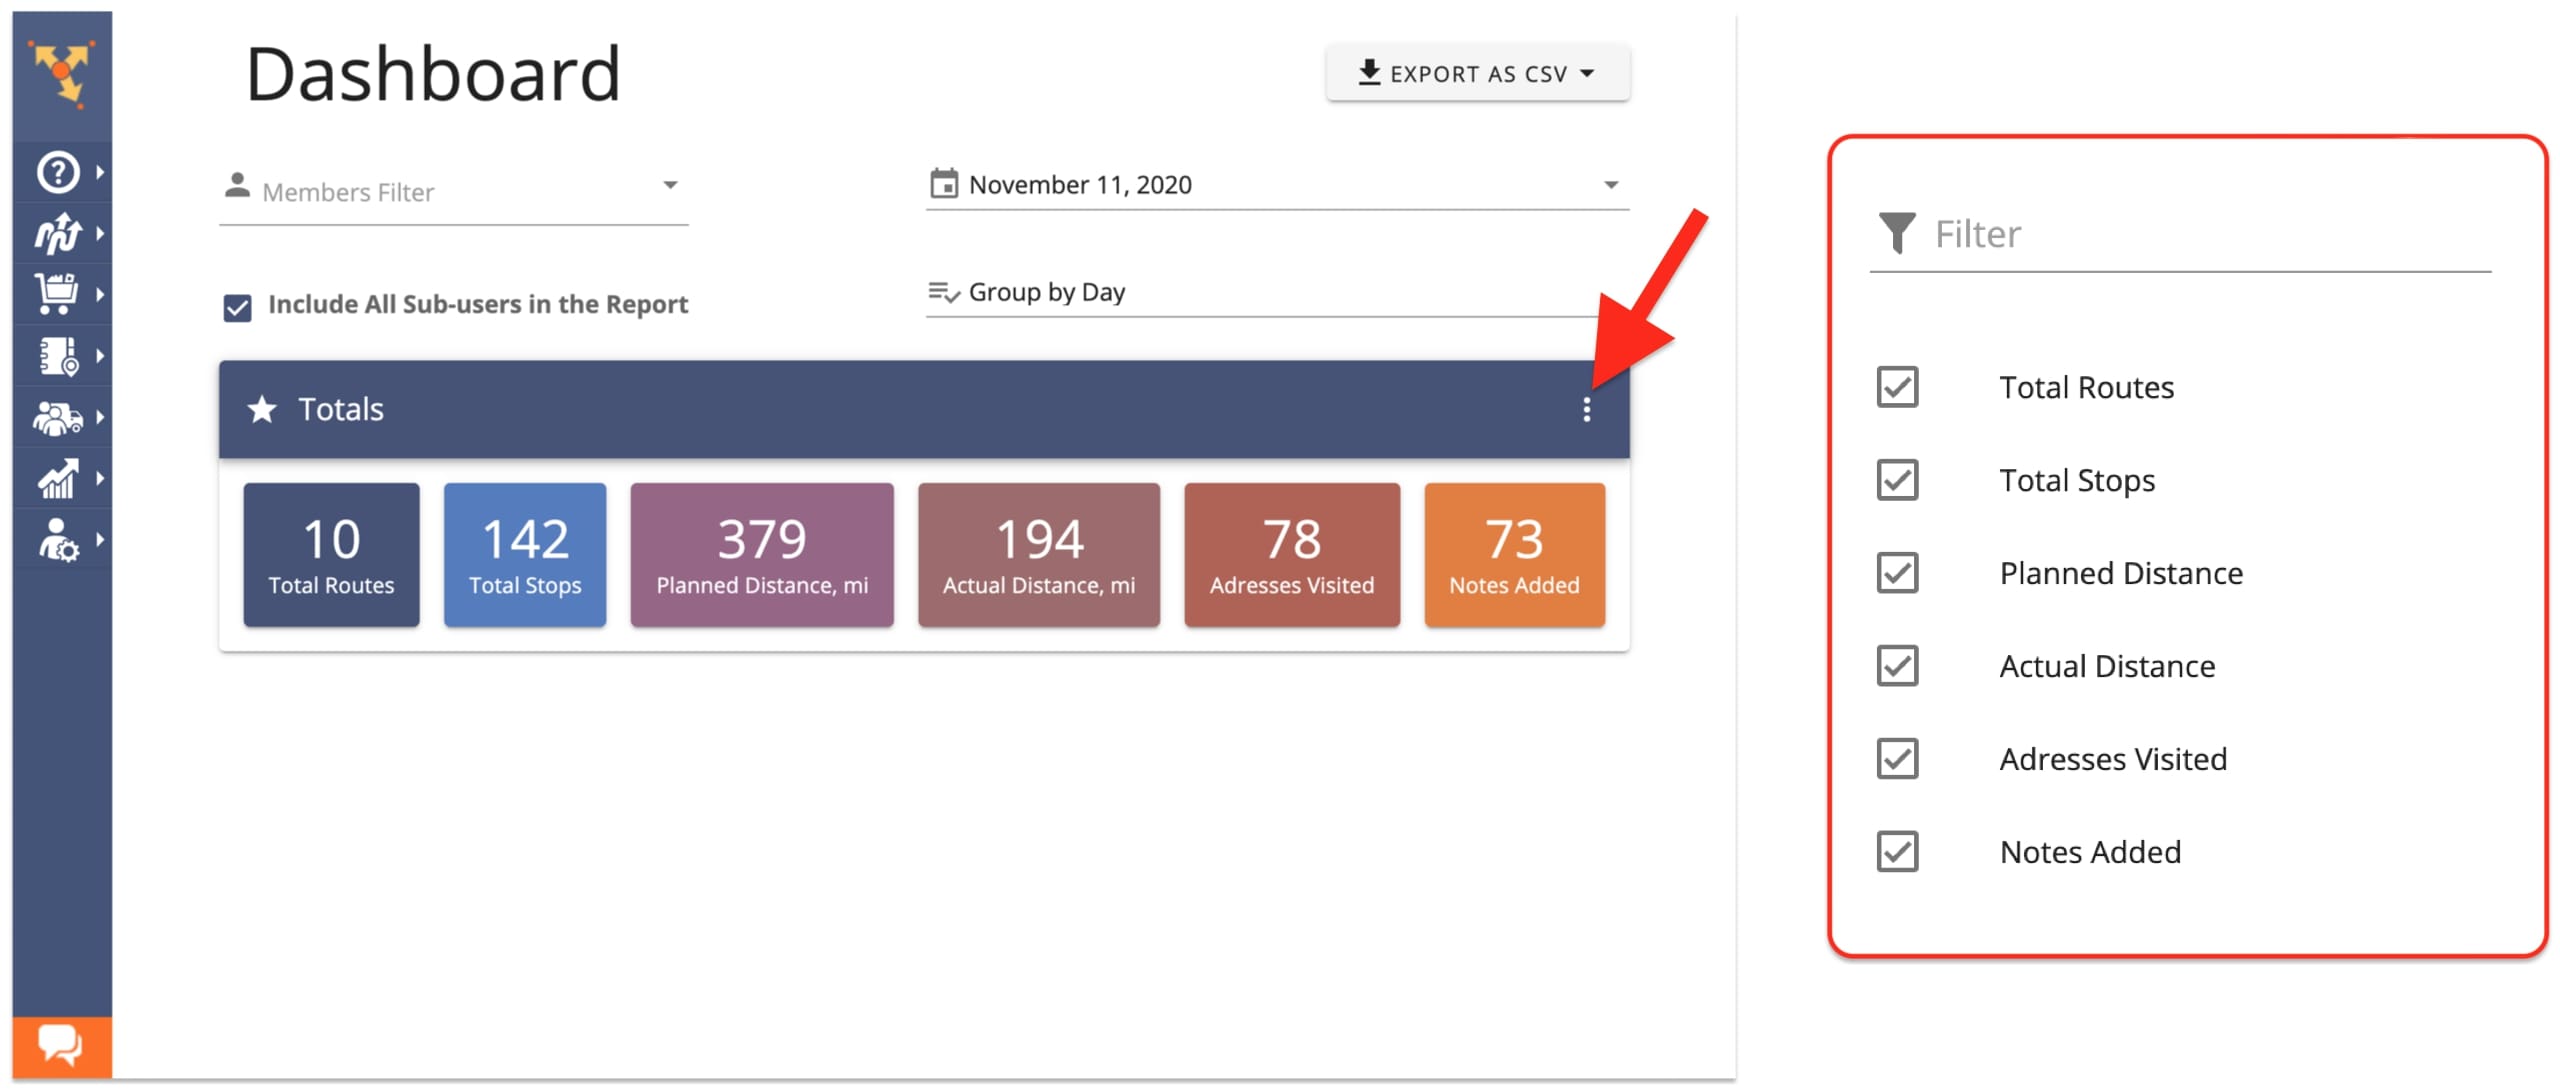
Totals
In this section, you’ll find top-level progress figures of your team members to get a comprehensive overview of the performance and key metrics.
For example, you can find total routes, total stops, planned distance and actual distance covered, total addresses visited, and notes added.
Graphs
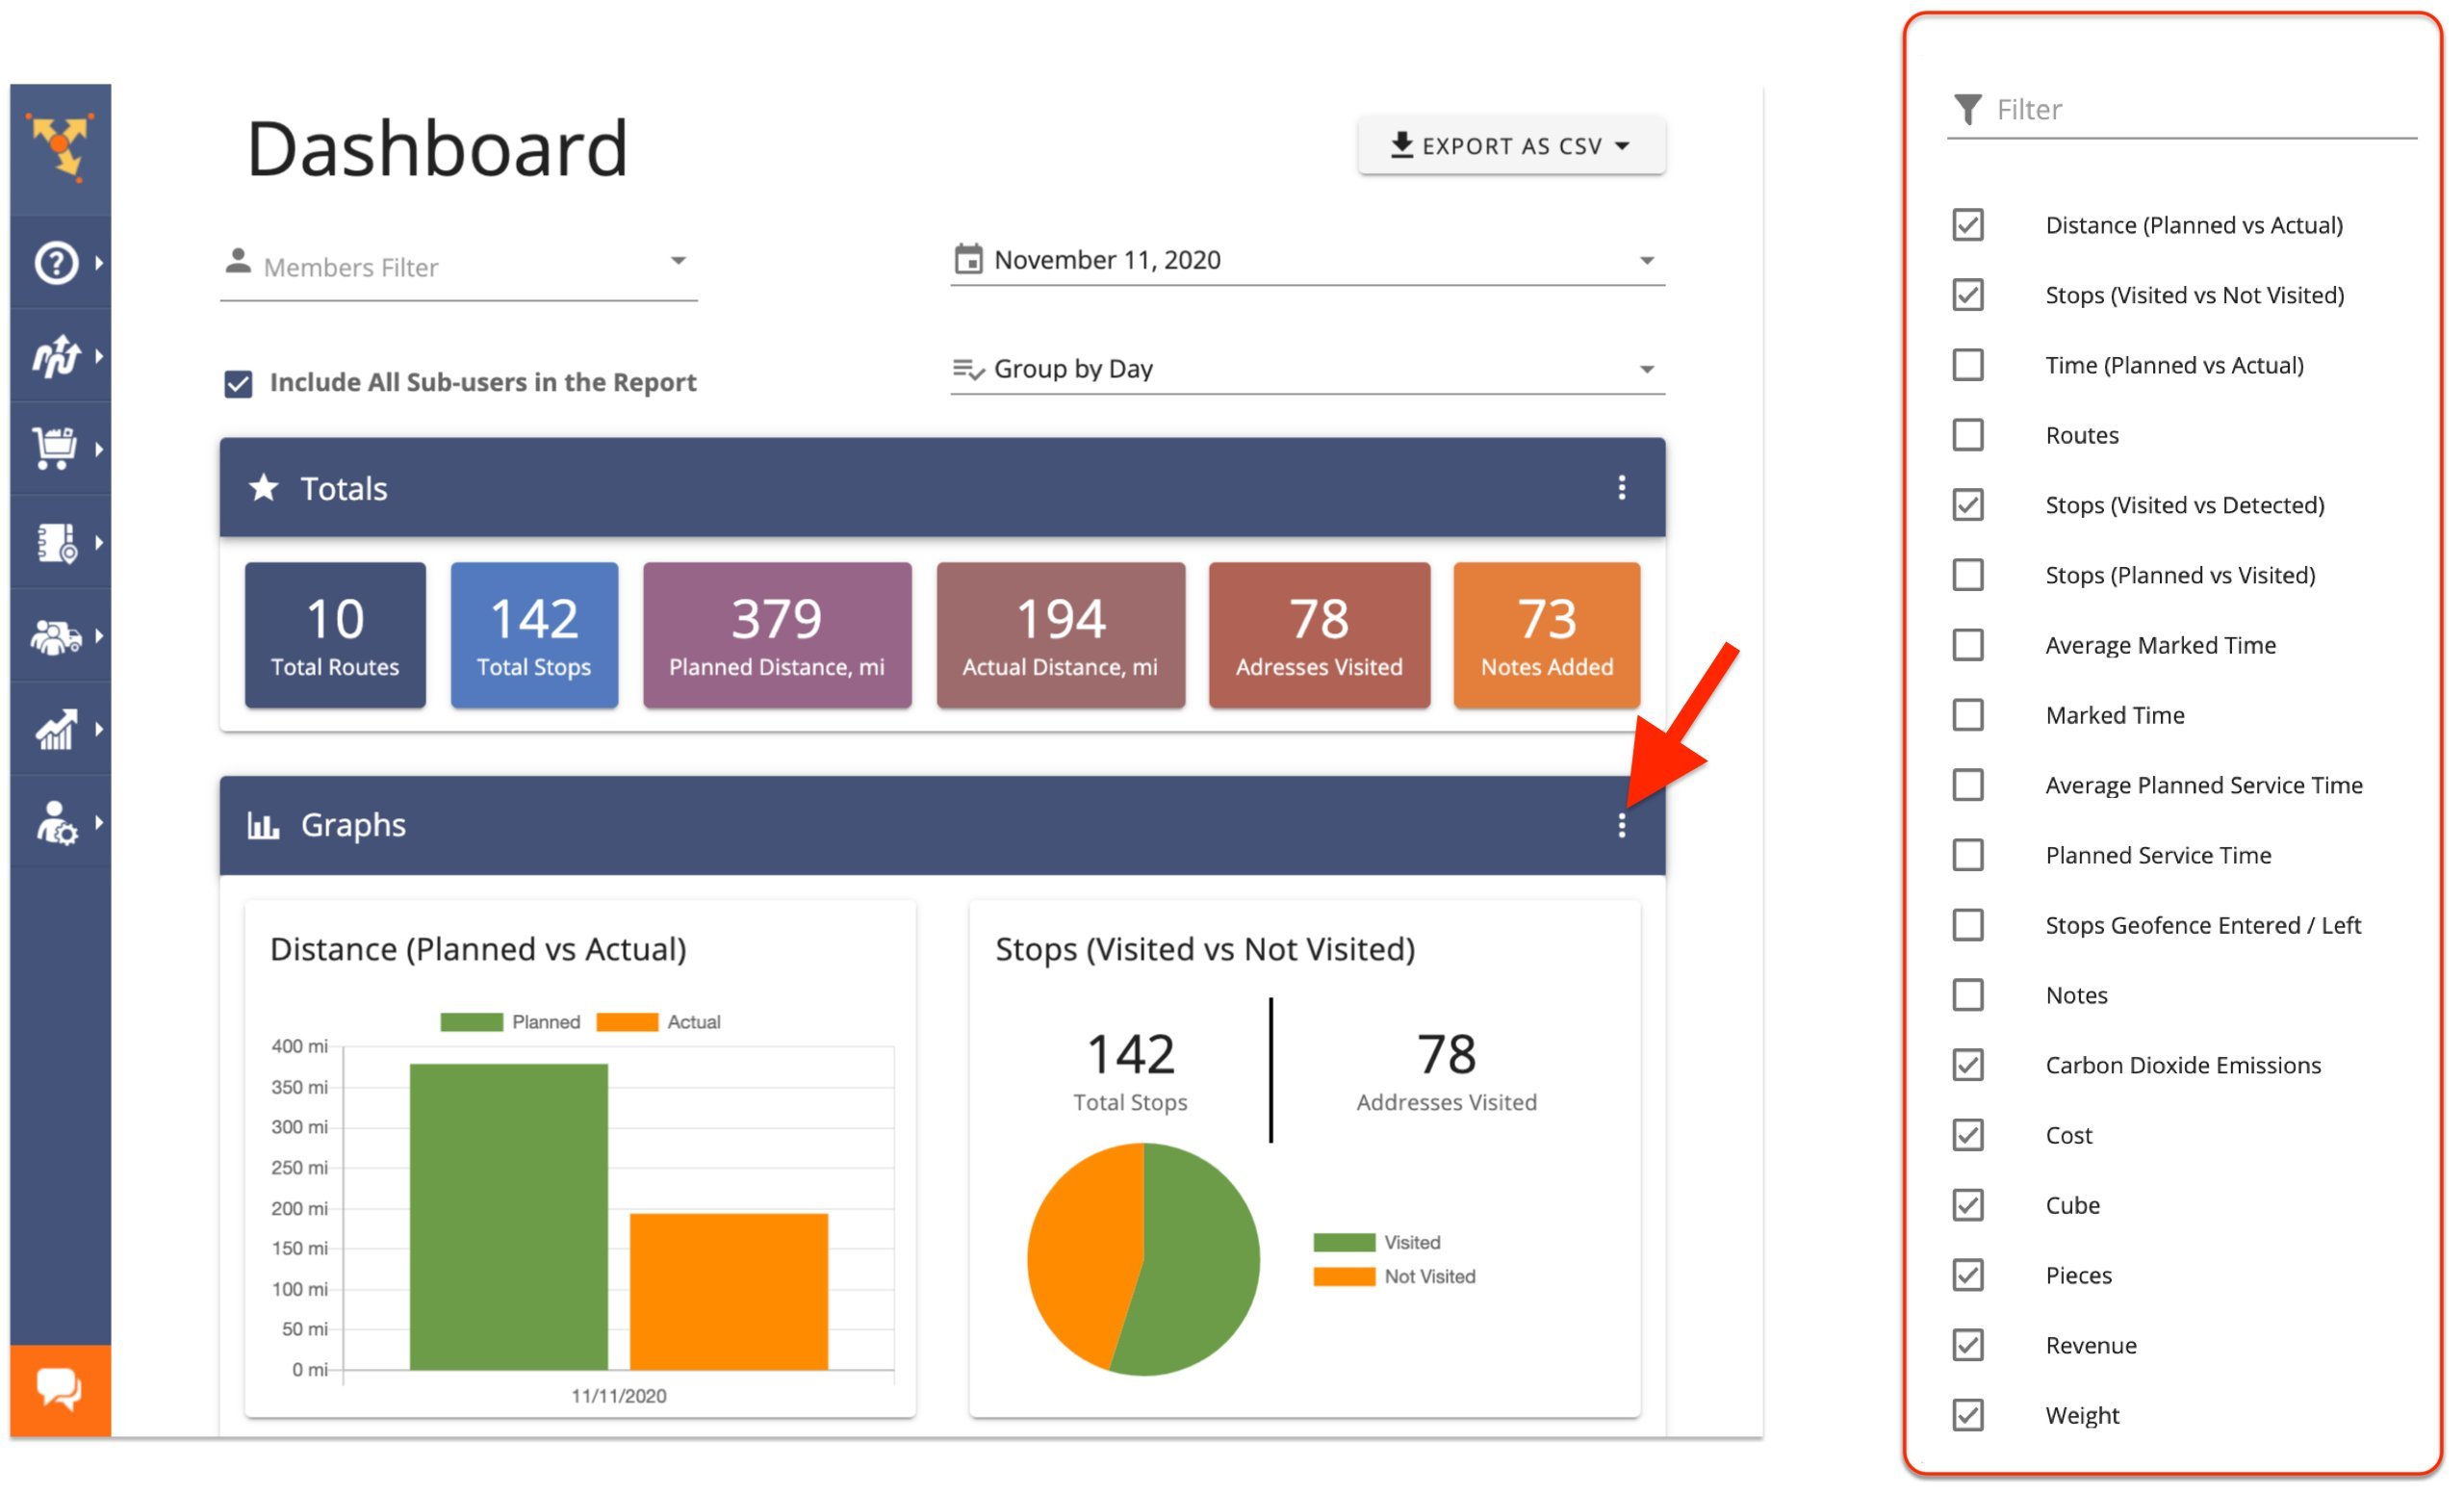
In this section, you’ll find visually informative graphs to learn and compare the performance of your fleets and teams.
Here’s a quick rundown of what all you can visualize:
- Planned vs. actual distance
- Planned vs. actual time
- Planned vs. visited stops
- Cost
- Revenue
- Weight, and more.
You can also group all the data on your Dashboard based on specific dates or date ranges and stop types in your routes which are highly useful for improving performance.
For example, when you group data according to stop type, Route4Me’s Dashboard organizes the displayed information based on the various stop types found in the routes scheduled for the chosen day or date range.
This feature allows you to determine the number of pick-ups, delivery, and other stops assigned to a specific driver on a given date. Also, you’ll find the status of each visit, such as completed, scheduled, and more.
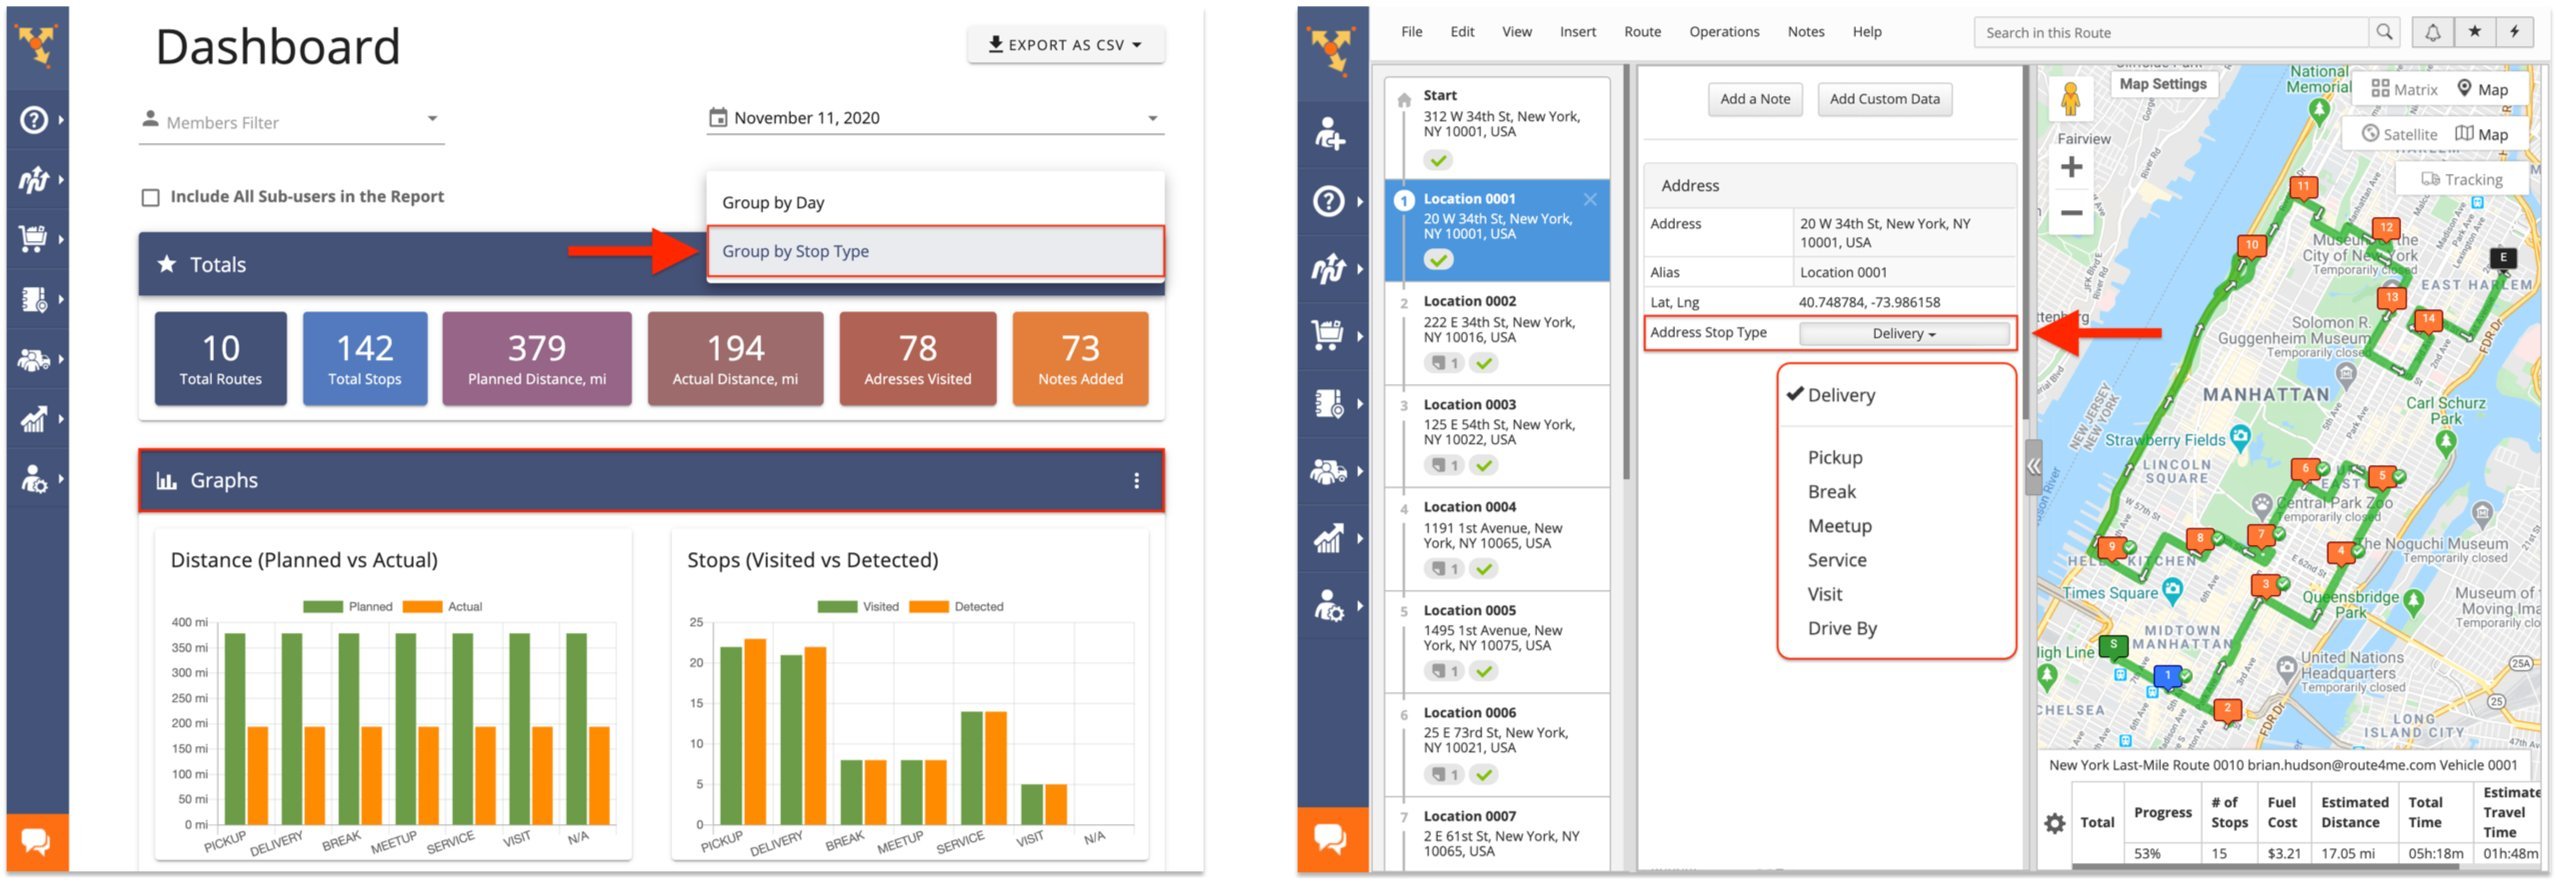
Such valuable insights enable you to easily track and manage your drivers’ and routes’ progress and performance. You can even export all the routes and data.
Here’s a step-by-step guide to learning more about Route4Me’s Dashboard Analytics.
Carbon Emission Statistics
Cutting down on emissions is more important than ever. But electric vehicles are still expensive. And the ones available are not apt for long-distance travel due to their limited operating range.
So, the most inexpensive way is to keep track of your vehicle’s emissions; this is where Route4Me’s vehicle routing software can help.
Route4Me’s delivery route optimization app lets you monitor how much carbon dioxide your entire fleet and each vehicle emits.
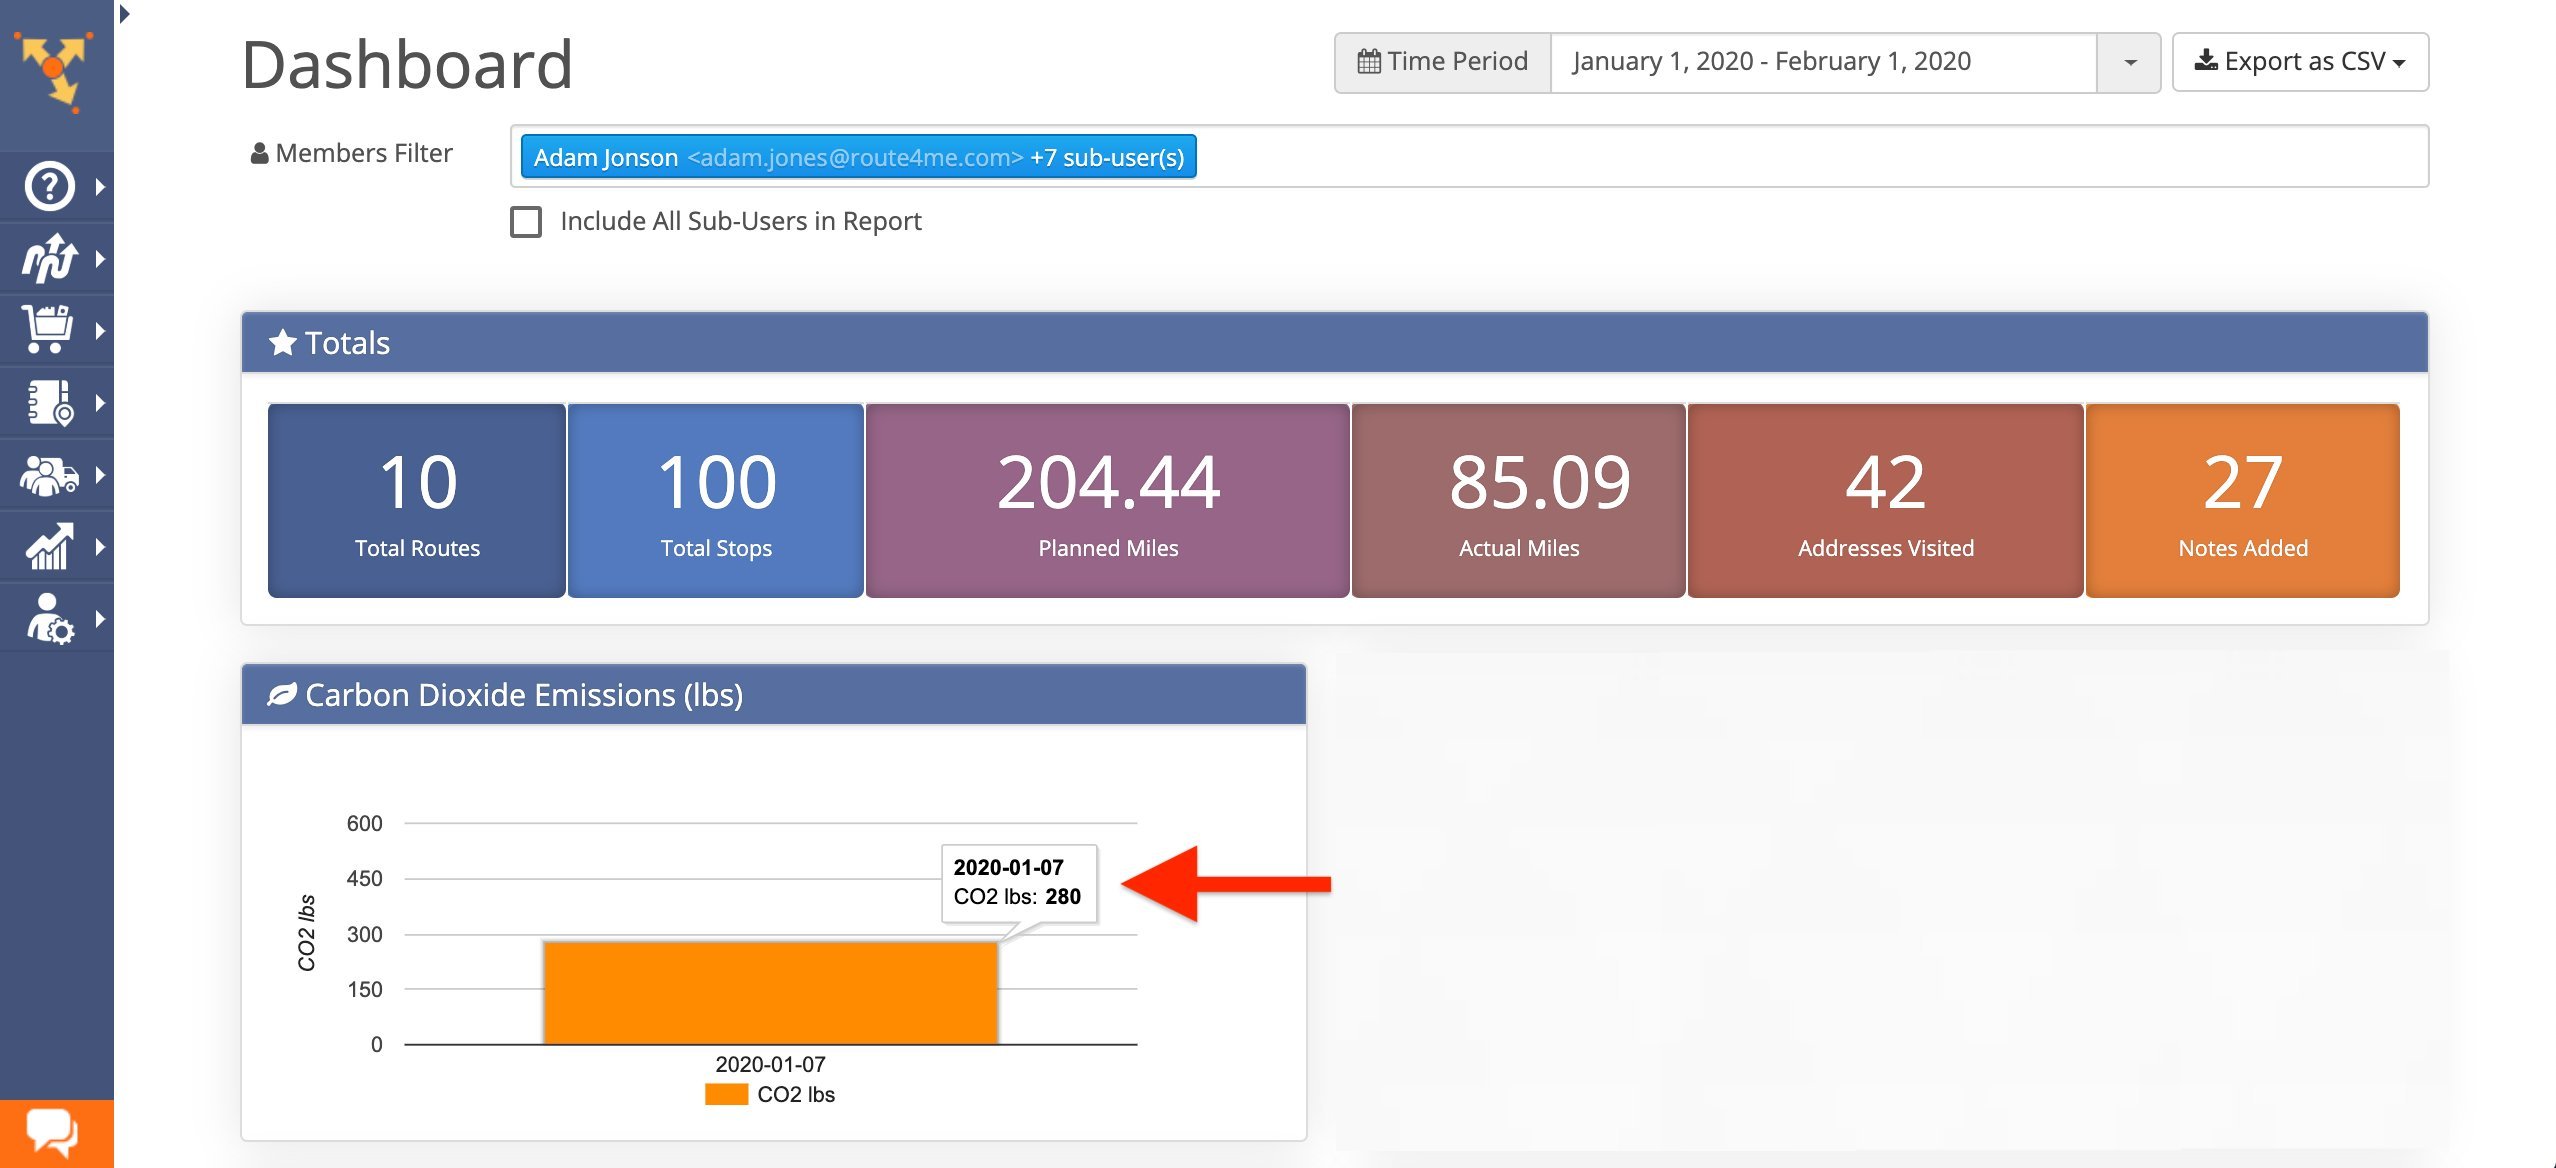
The amount of emitted Carbon dioxide is determined based on the fuel type and the miles per gallon (mpg) of the vehicles assigned to the routes scheduled within the chosen time range and associated with selected team members.
The best part is that Route4Me’s multi-stop route optimization software even helps you find the carbon emissions data of your future routes.
Here’s a step-by-step guide to using the carbon emission analytics feature.
Activity Stream
Route4Me’s final mile software offers Activity Stream, an audit-logging tool that enables you to audit the performance of your entire team, detect fraudulent activities, check the overall health of your business, and much more.
The Activity Stream even records and stores all the actions performed using Route4Me, whether it’s the web platform or the mobile app. And you can view all the events associated with your routes, such as:
- When and what routes are created,
- When drivers marked destinations as “Visited,” and when they actually arrived at those destinations,
- When notes were added to route stops and many other activities all in one place.
In addition, you can filter the events by many parameters to find any activity among hundreds of thousands of logged actions seamlessly.
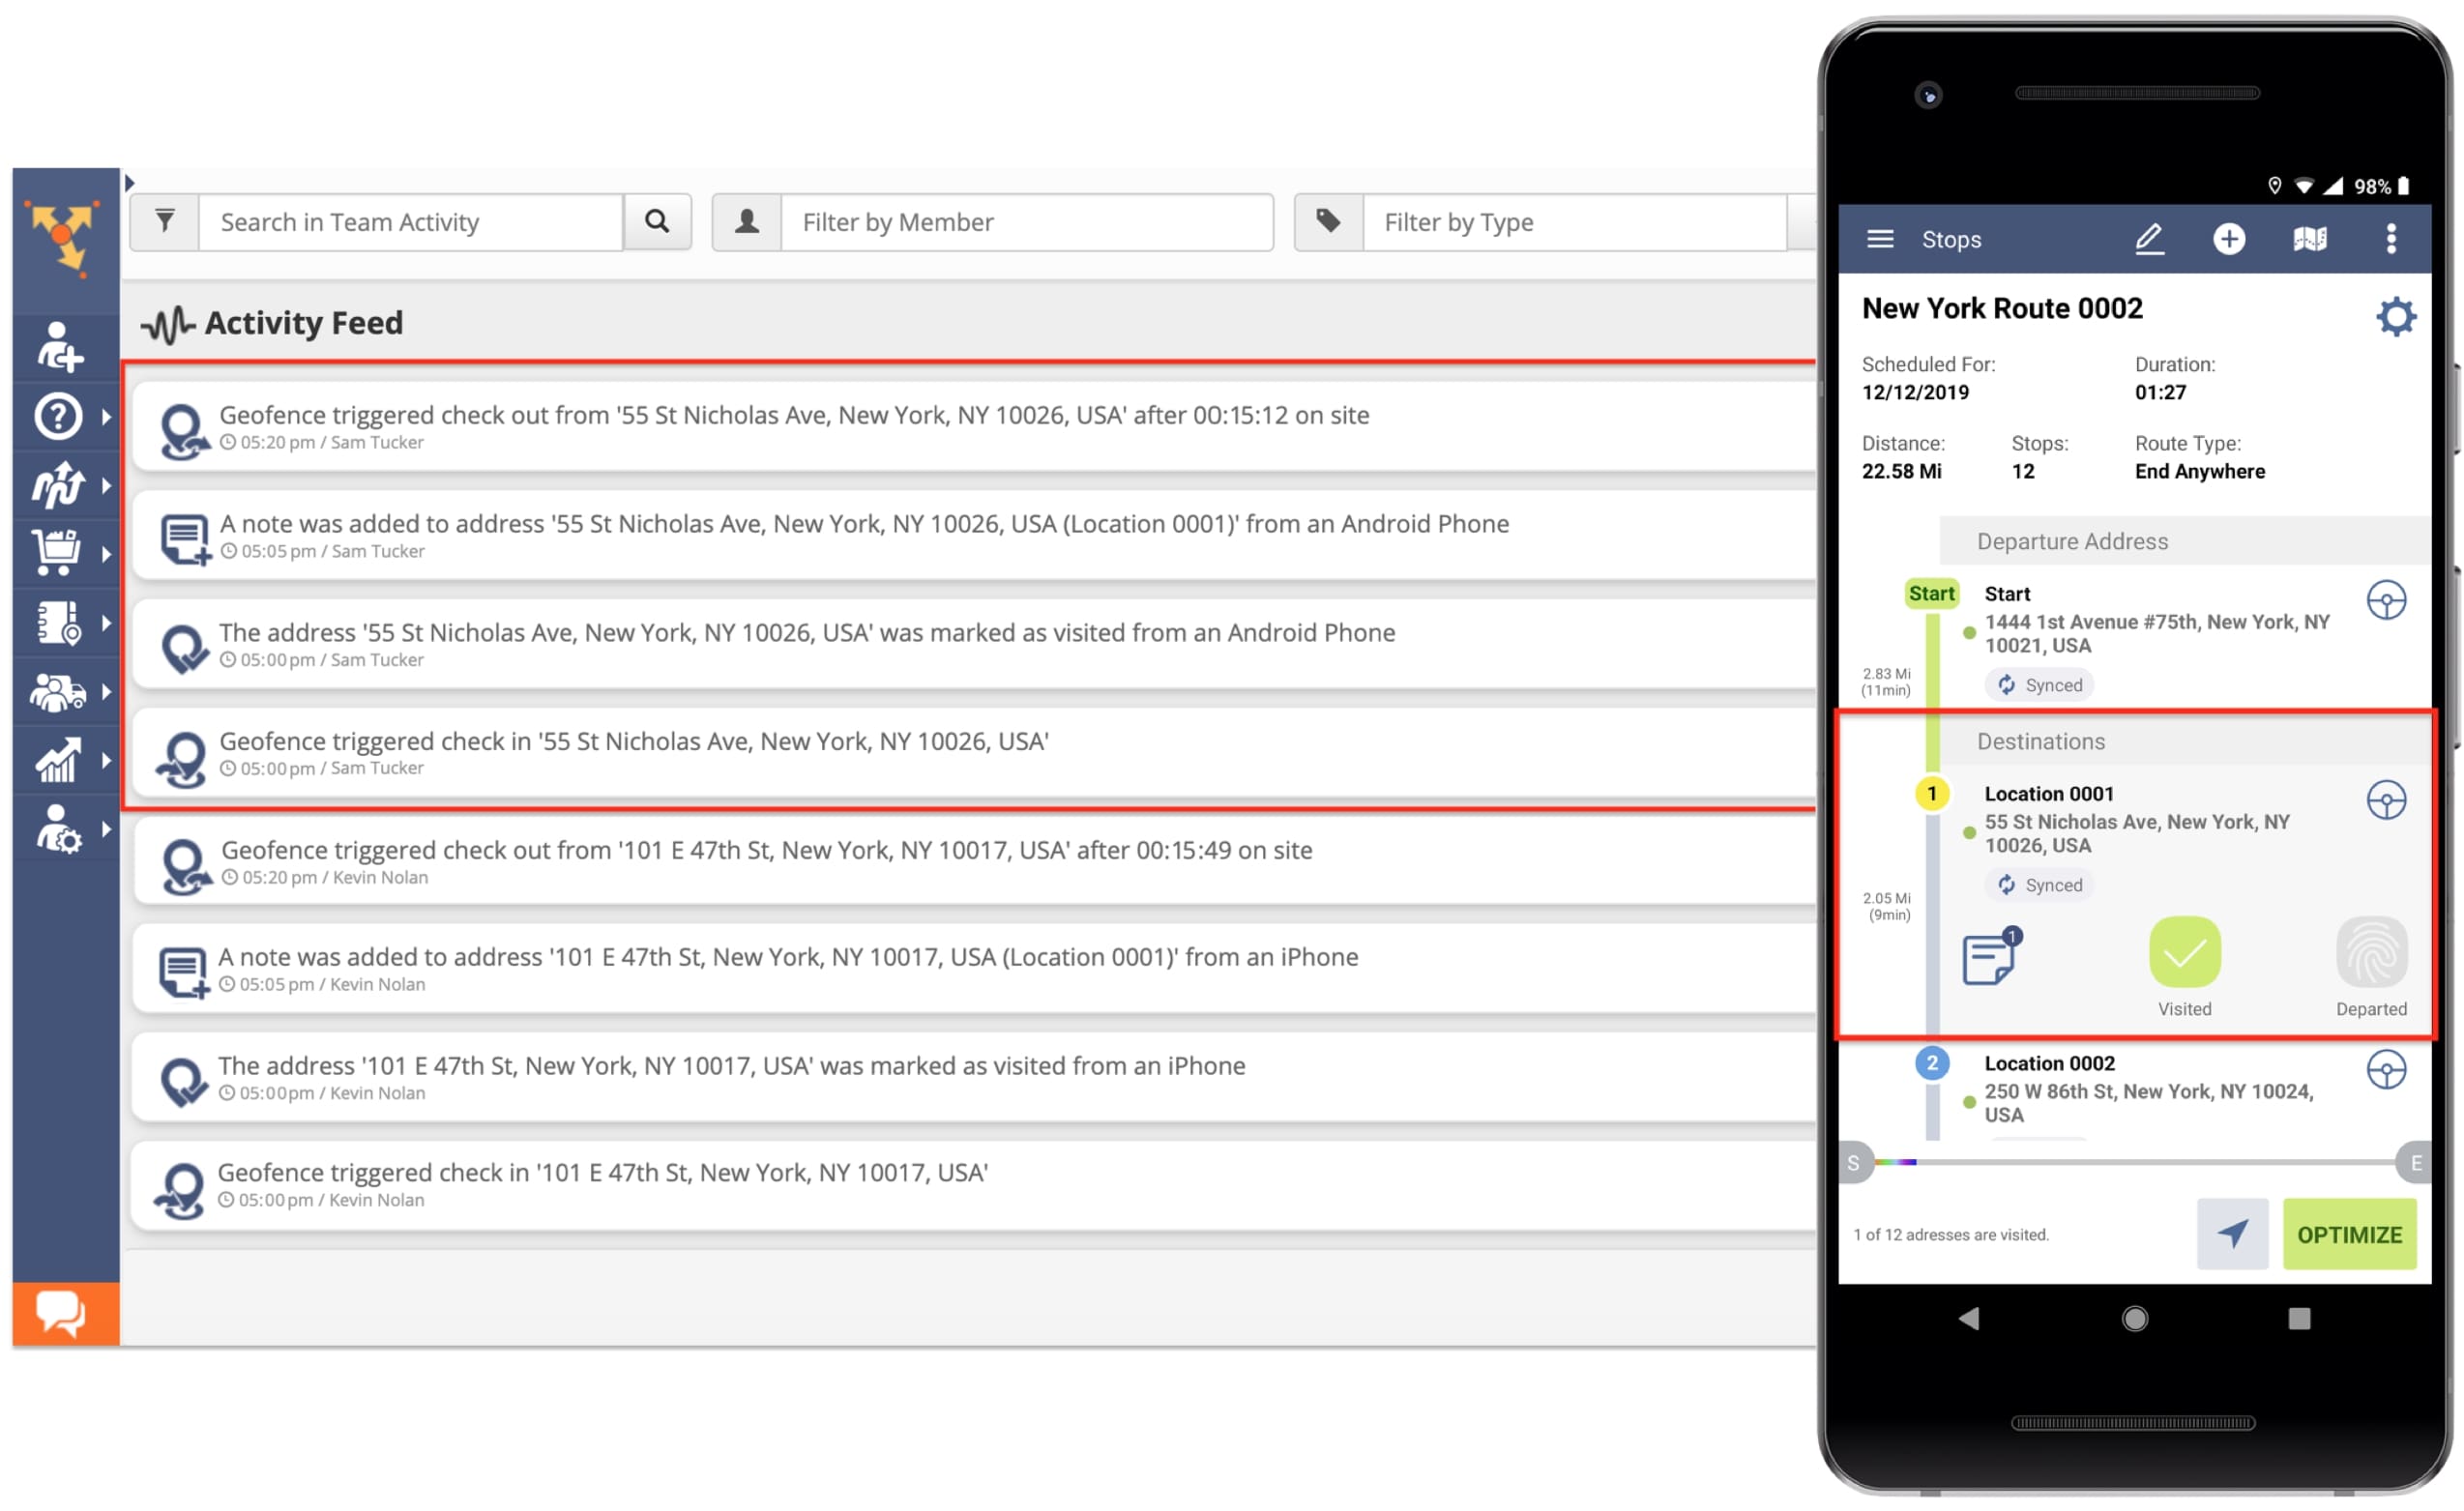
Learn in detail how Route4Me’s Activity Stream helps track real-time route activity.
Route Operations Matrix
Route Operations Matrix tool provides a comprehensive visual overview route’s progress in real-time.
The system automatically calculates the “Result” time at each route stop and displays the variance between planned and dynamic (predicted) arrival times. This enables you to assess any deviations from the schedule quickly.
The Operations Matrix offers real-time updates for all metrics, enabling you to monitor your entire routing operation on one screen. This ensures timely visits and services for your customers.
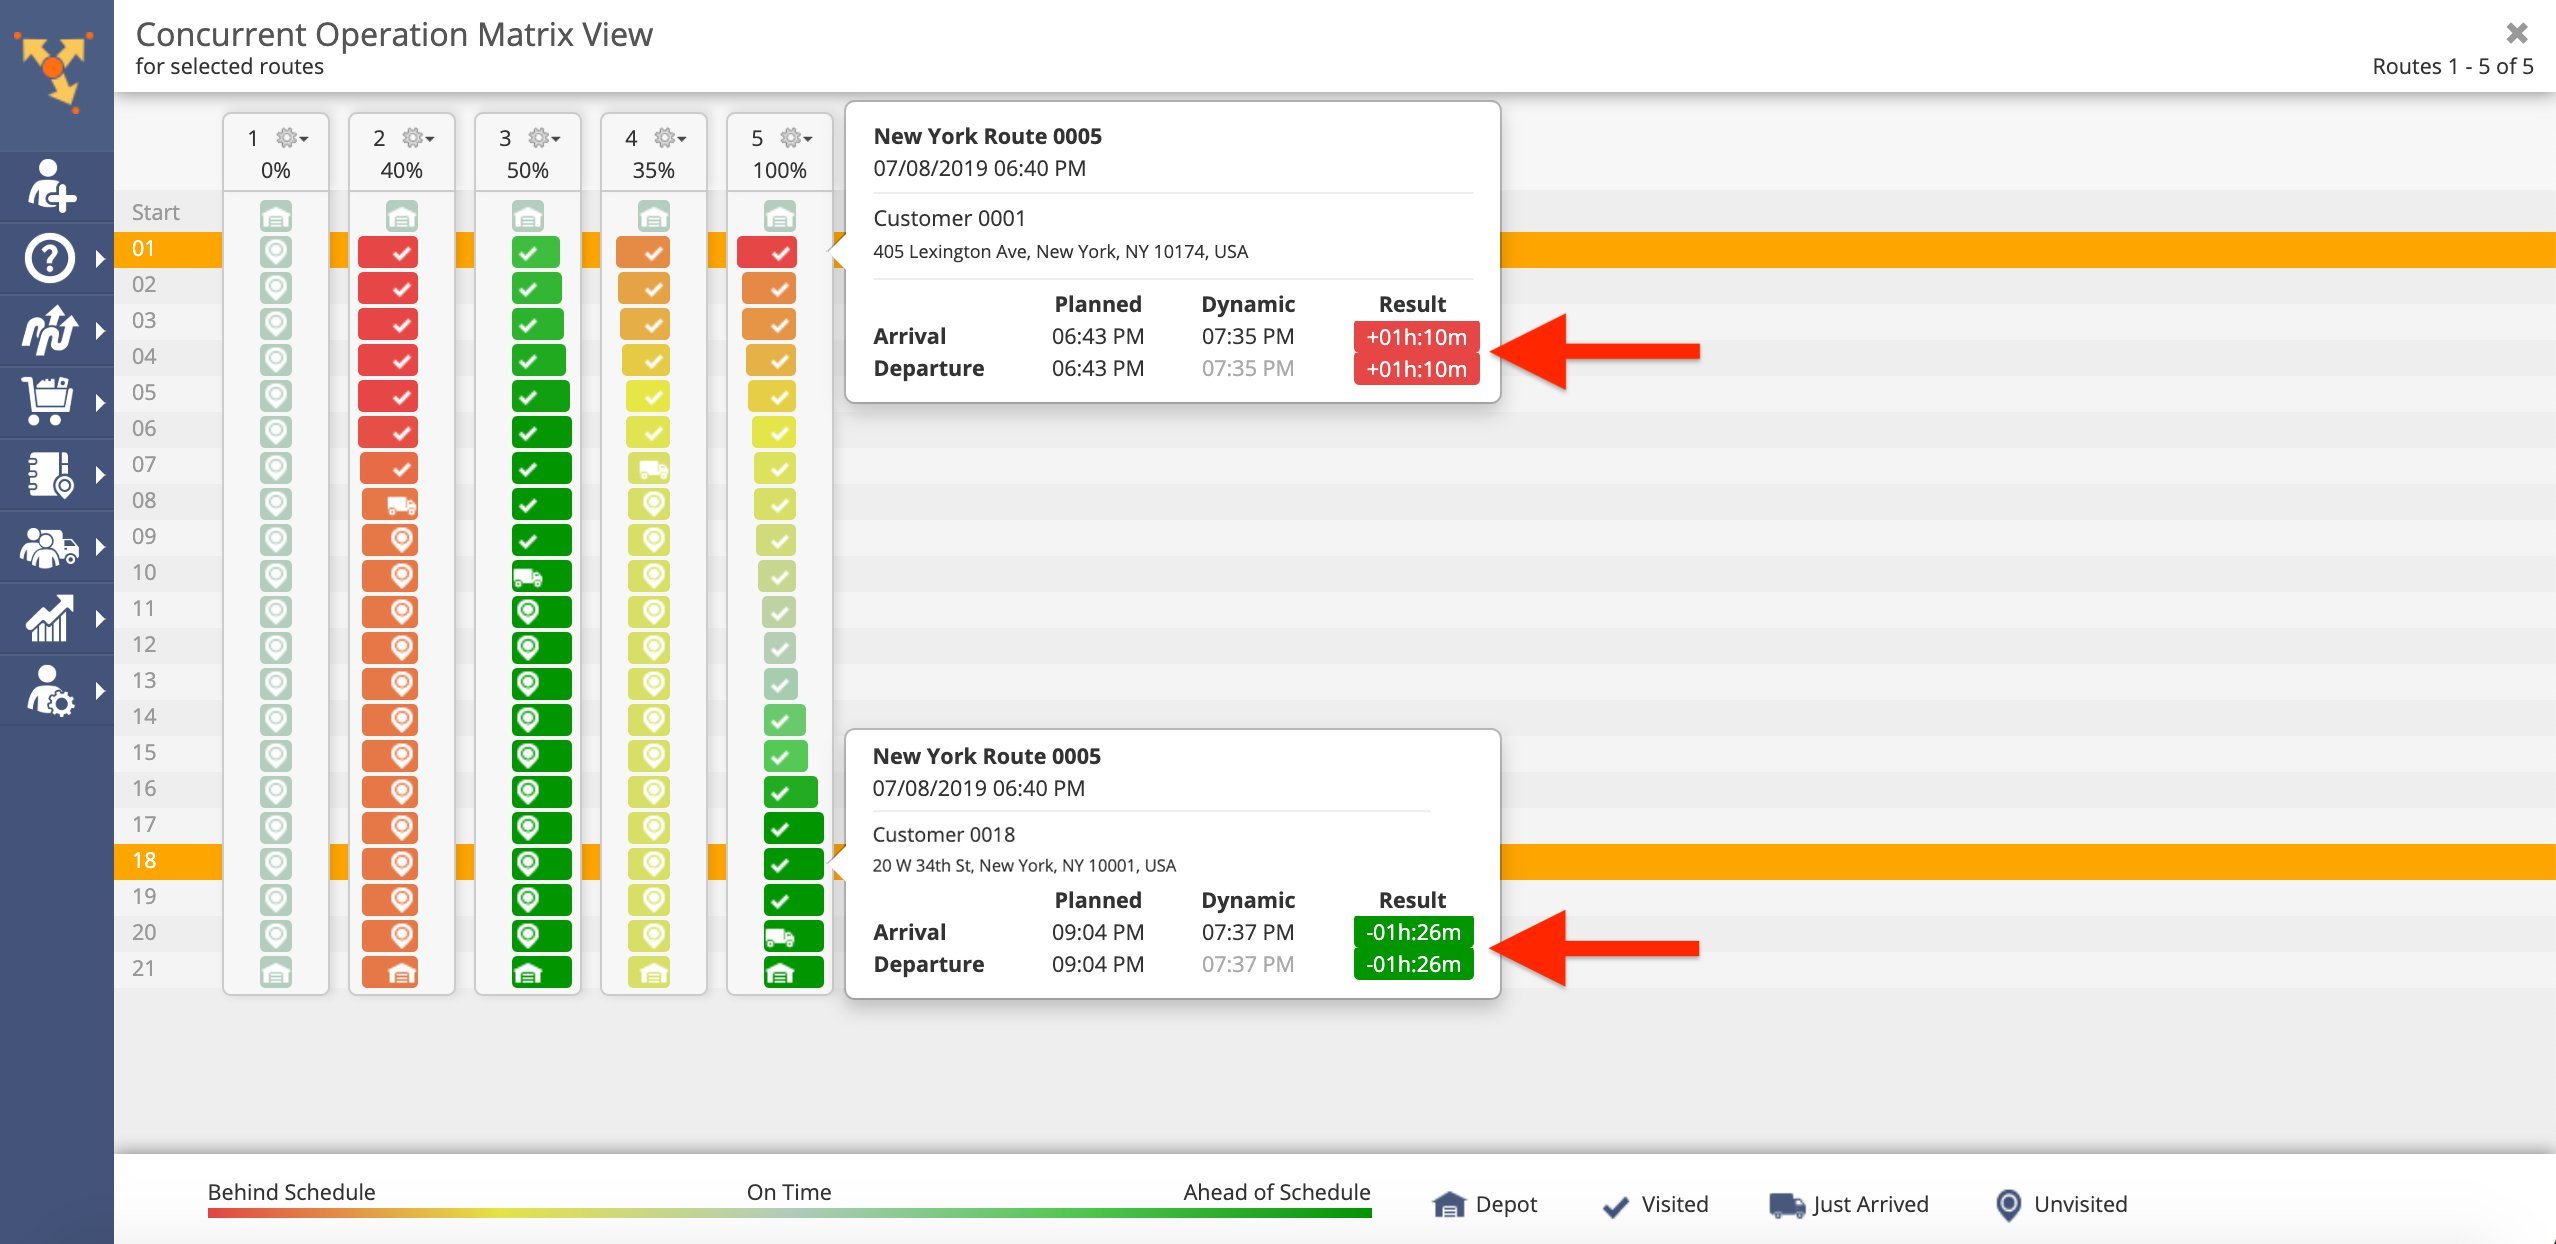
Learn in detail about the Route Operations Matrix tool.
Frequently Asked Questions (FAQs) about Last-Mile Analytics
What is last-mile reporting?
What does a last-mile analyst do?
Final Thoughts about Last-Mile Analytics
So, now you have a handy resource to navigate the world of last-mile analytics like a pro. With this guide and Route4Me’s route optimization solution, you can harness the power of real-time data to optimize your delivery operations and ensure customer satisfaction.
From tracking delivery performance to analyzing route efficiency, Route4Me’s delivery route planner app provides all the tools to help you make informed decisions and stay one step ahead.
So, sign up for Route4Me’s Get Started and unlock the full potential of last-mile analytics.
Want To See For Yourself How Route4Me Can Help Track and Analyze Last-Mile Deliveries Efficiently?

